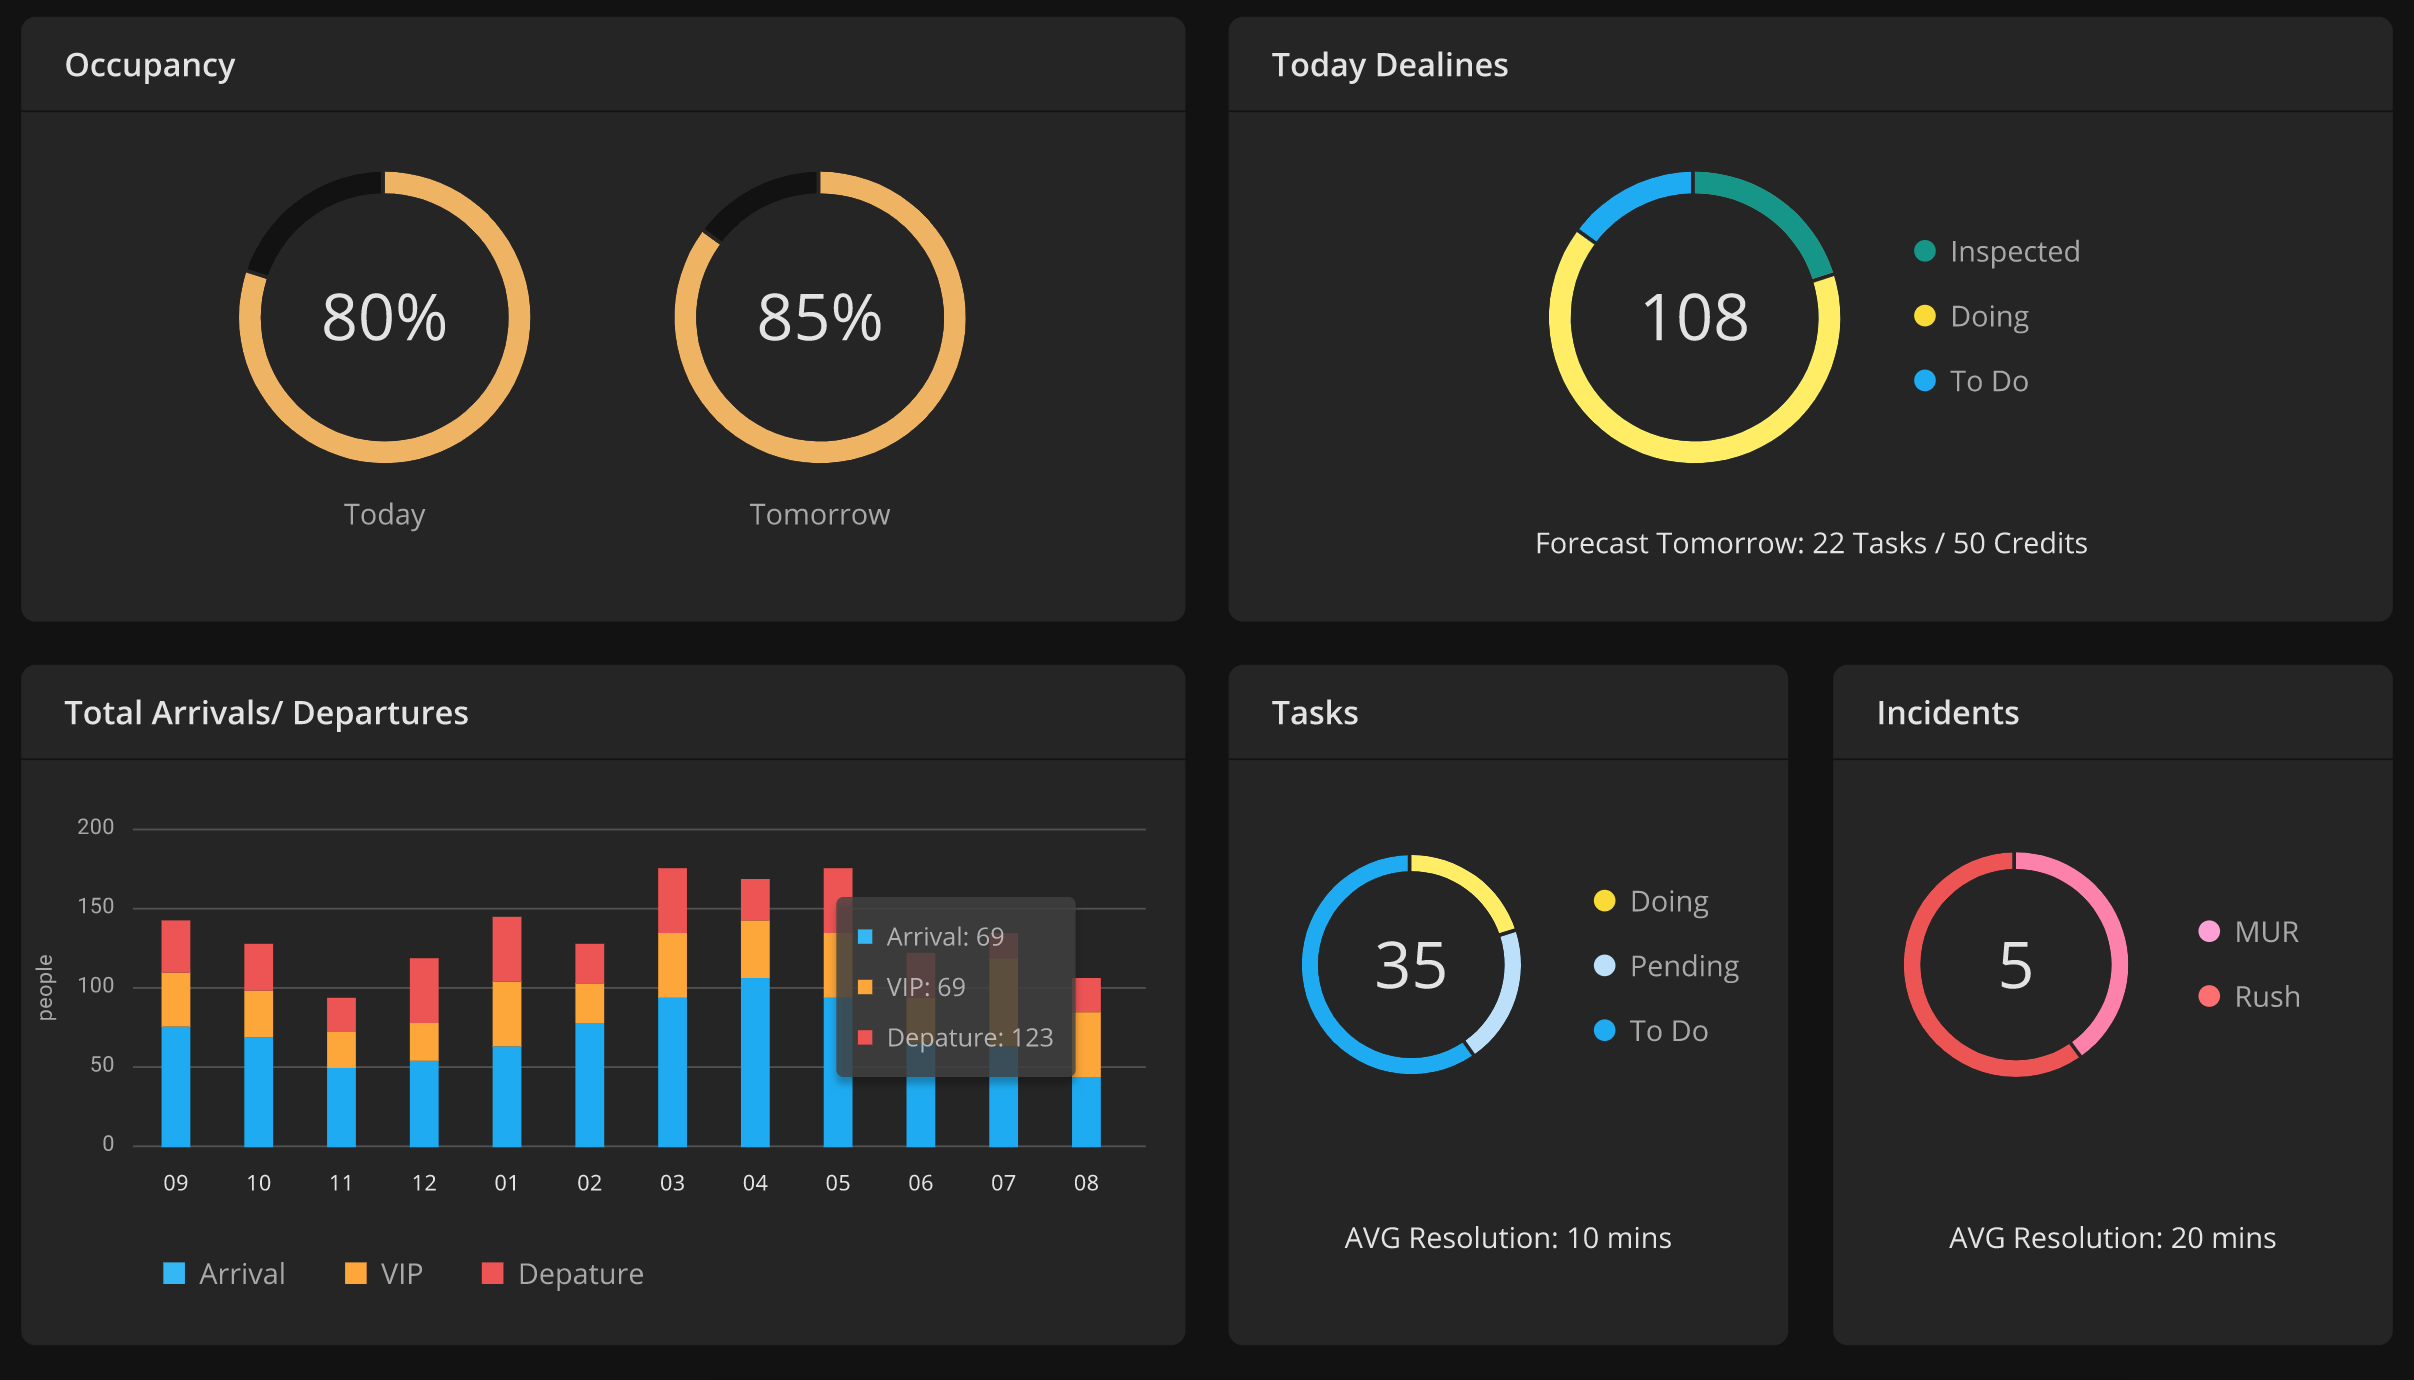
G2 是一套基于可视化编码的图形语法,以数据驱动,具有高度的易用性和扩展性,用户无需关注各种繁琐的实现细节,一条语句即可构建出各种各样的可交互的统计图表。
昨天接到一个任务要实现:
以前用过 Hightcharts 感觉相当麻烦。
Hightcharts
一个饼图的示例代码长这样子: 注:以下代码都假设你已经导入了相应的库。
<div id="container"></div>Highcharts.chart('container', {
chart: {
plotBackgroundColor: null,
plotBorderWidth: null,
plotShadow: false,
type: 'pie'
},
title: {
text: 'Browser market shares in January, 2018'
},
tooltip: {
pointFormat: '{series.name}: <b>{point.percentage:.1f}%</b>'
},
plotOptions: {
pie: {
allowPointSelect: true,
cursor: 'pointer',
dataLabels: {
enabled: true,
format: '<b>{point.name}</b>: {point.percentage:.1f} %'
}
}
},
series: [{
name: 'Brands',
colorByPoint: true,
data: [{
name: 'Chrome',
y: 61.41,
sliced: true,
selected: true
}, {
name: 'Internet Explorer',
y: 11.84
}, {
name: 'Firefox',
y: 10.85
}, {
name: 'Edge',
y: 4.67
}, {
name: 'Safari',
y: 4.18
}, {
name: 'Sogou Explorer',
y: 1.64
}, {
name: 'Opera',
y: 1.6
}, {
name: 'QQ',
y: 1.2
}, {
name: 'Other',
y: 2.61
}]
}]
});个人感觉 Highcharts 的套路是配置式的,它内置好各种图表的默认配置,你要做的就是,配置它是什么类型图表,给 series 喂数据。
Antv G2
来看看 Antv G2 的套路,直接上代码。
<div id="chart"></div>var data = [{
item: '事例一',
count: 40,
percent: 0.4
}, {
item: '事例二',
count: 21,
percent: 0.21
}, {
item: '事例三',
count: 17,
percent: 0.17
}, {
item: '事例四',
count: 13,
percent: 0.13
}, {
item: '事例五',
count: 9,
percent: 0.09
}];
var chart = new G2.Chart({
container: 'chart',
forceFit: true,
height: window.innerHeight
});
chart.source(data, {
percent: {
formatter: function formatter(val) {
val = val * 100 + '%';
return val;
}
}
});
chart.coord('theta', {
radius: 0.75
});
chart.tooltip({
showTitle: false,
itemTpl: '<li><span style="background-color:{color};" class="g2-tooltip-marker"></span>{name}: {value}</li>'
});
chart.intervalStack().position('percent').color('item').label('percent', {
formatter: function formatter(val, item) {
return item.point.item + ': ' + val;
}
}).tooltip('item*percent', function(item, percent) {
percent = percent * 100 + '%';
return {
name: item,
value: percent
};
}).style({
lineWidth: 1,
stroke: '#fff'
});
chart.render();G2 的套路是,定义好数据,然后用 G2 的图形语法把数据转换为图表,它是以数据驱动的,同一数据结构可以用不同的图形语法画不同的图表。个人感觉更直观,更好操控。
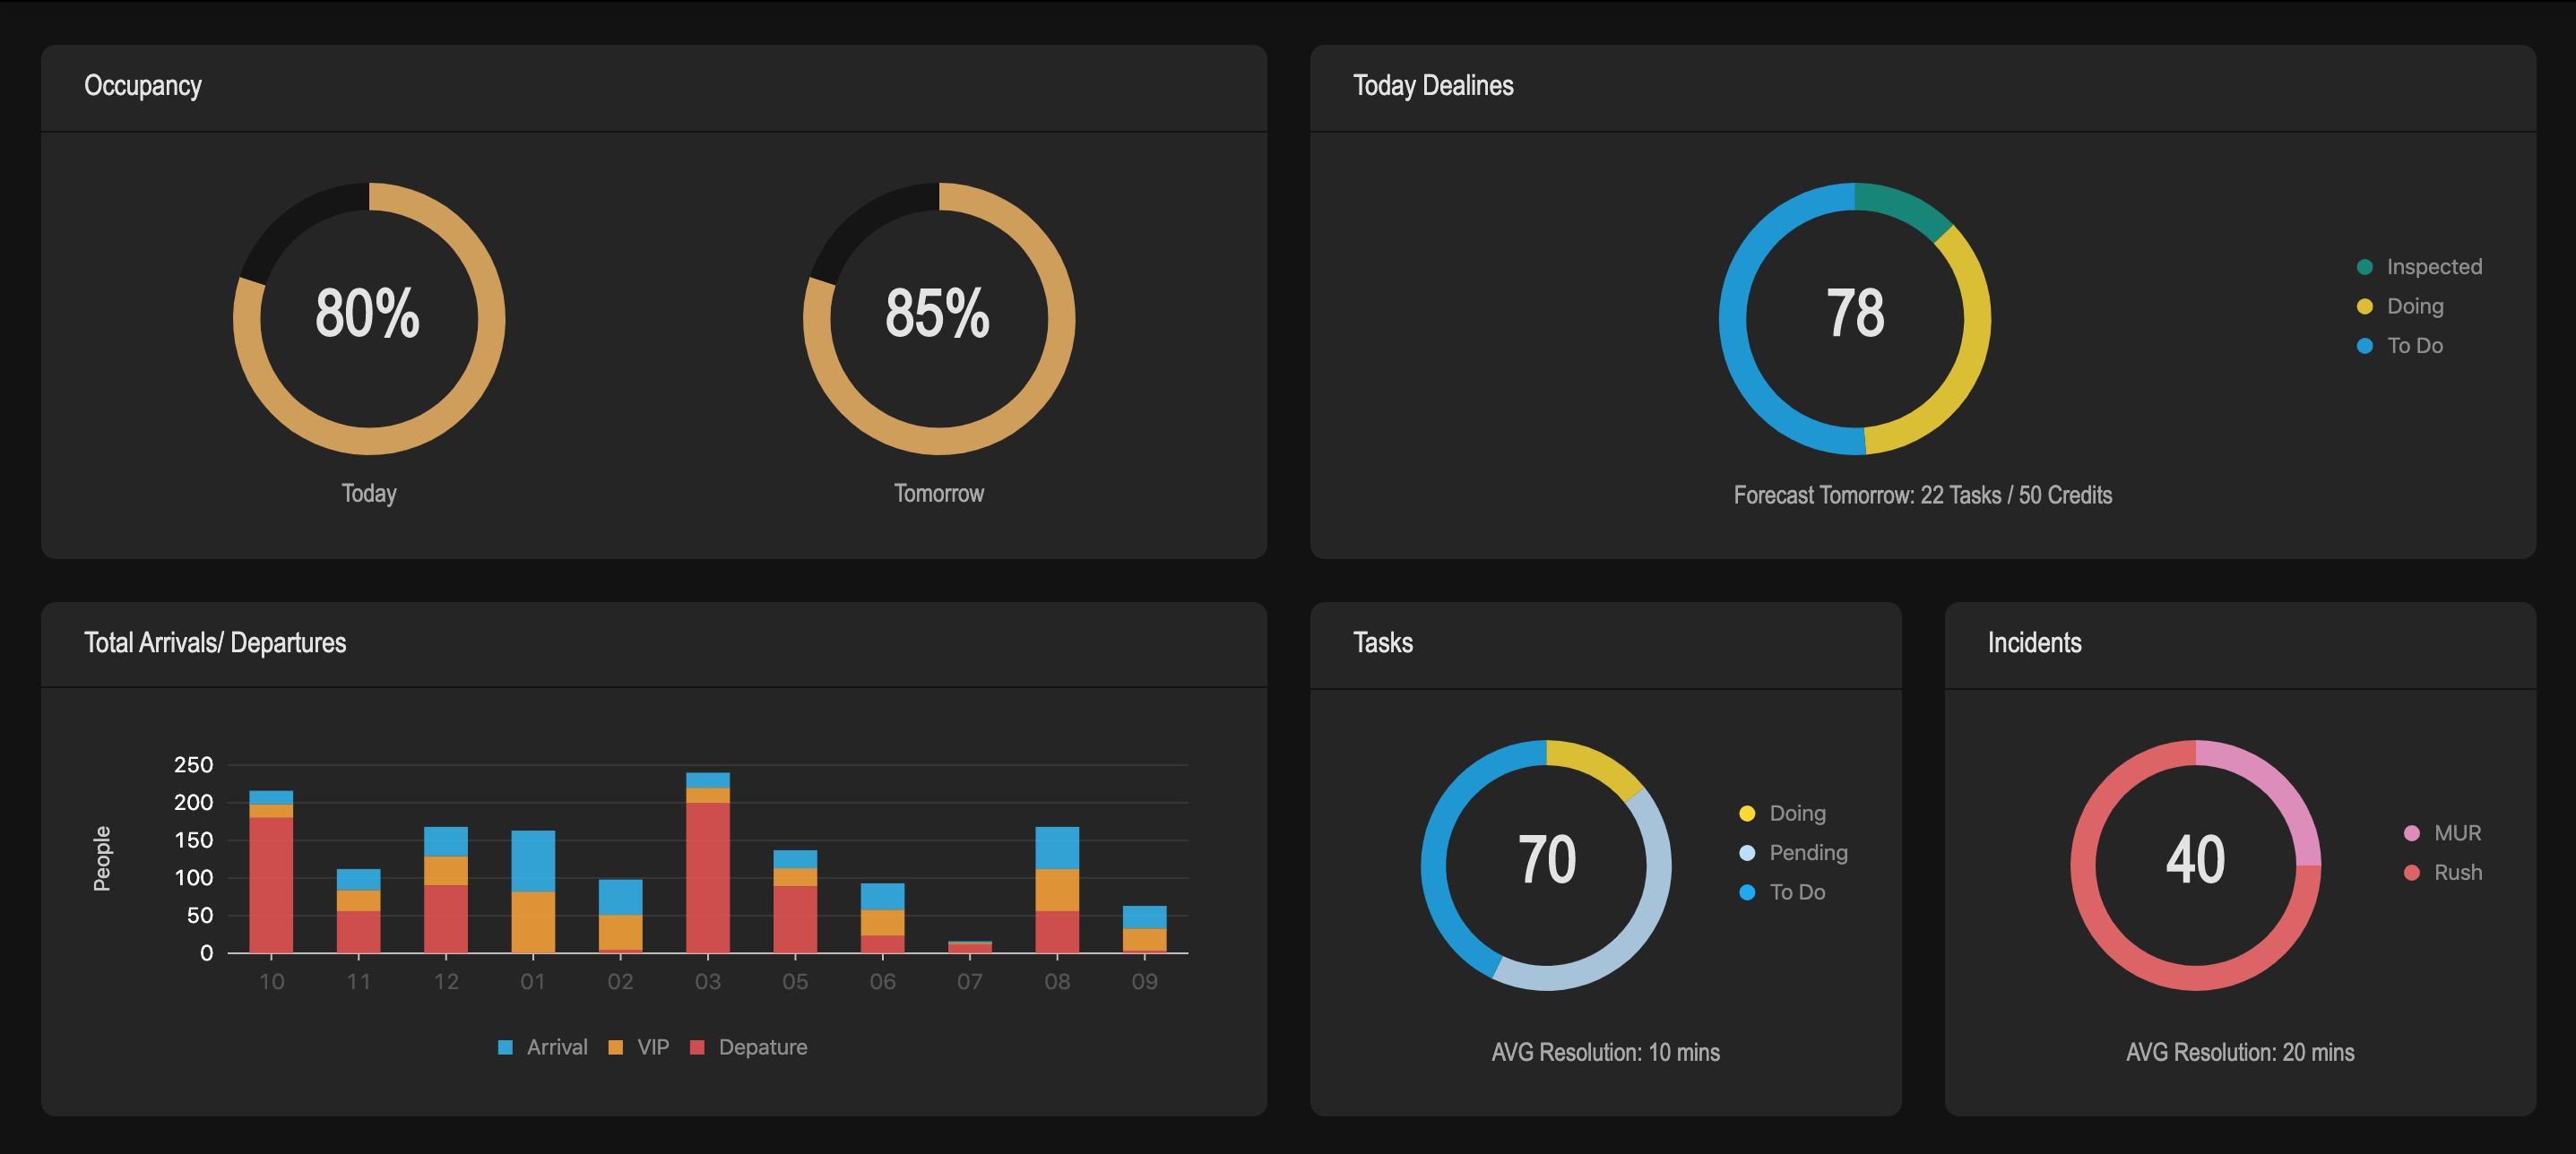
最后来看看用 G2 还原设计图

结论:G2 更直观,更好操控图形的细节。